← All work

Reporting · Loblaw · 2026

Power BI reports, with the data swapped out

These are real report pages from the Power BI Service, not mock-ups. I built the layouts and the logic. Every name, store number and figure was replaced with a fictional value before capture, because the real data isn't mine to publish.

13
Banner and region pages in the dwell suite
5
Pages in the Driver Manager Dashboard
2
Delay owners: store caused or planning caused
0
Real names or figures on this page

The reports

Names, store numbers and figures are fictional. Layouts, columns and logic are the real reports.
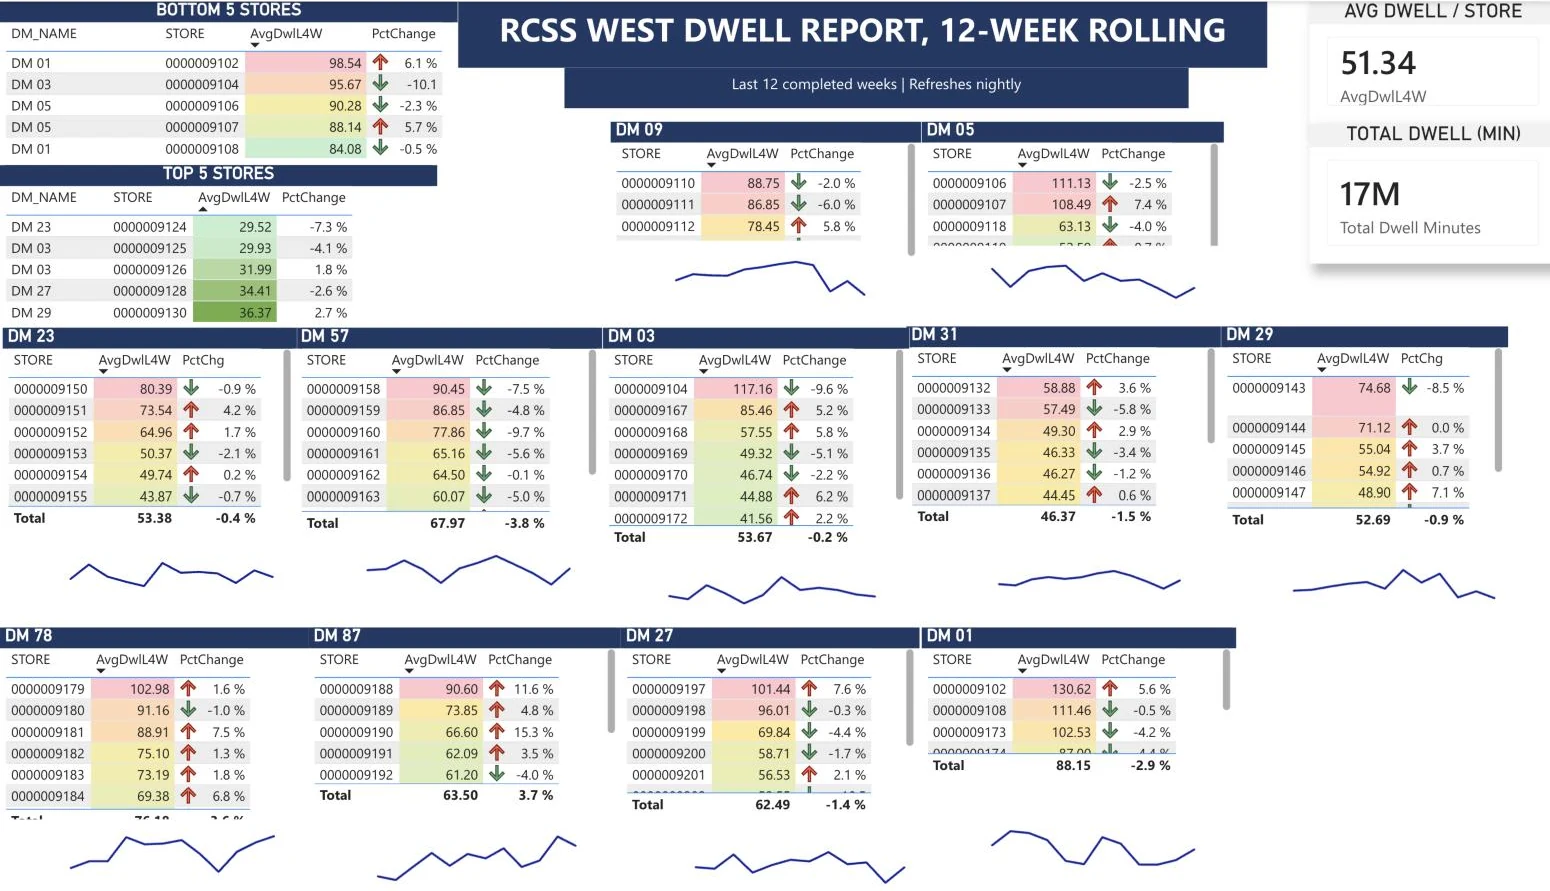
A store dwell report page: worst and best stores, then a block per district manager with average dwell, change and a 12-week trend
Store dwell, one page of thirteen. Each banner and region gets a page like this: the five worst and five best stores, then a block per district manager with four-week average dwell, the change, and a 12-week trend. Shading points at the worst stores first, and a load-level detail page sits behind it.
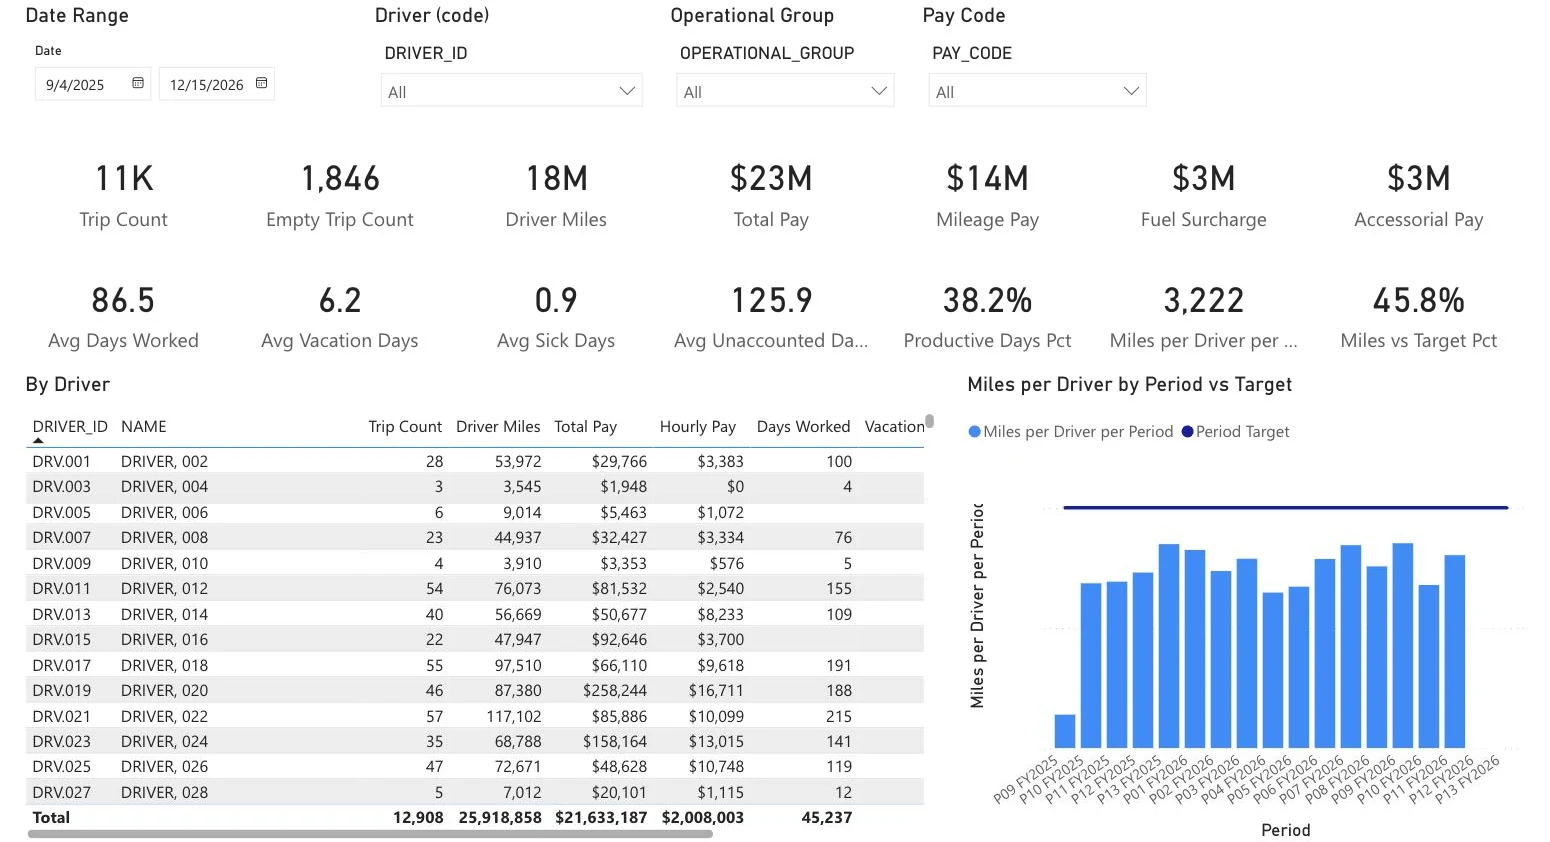
The Trip Summary page: trip, mileage and pay totals, attendance averages, a table by driver and miles per driver by period against target
Driver Manager Dashboard, Trip Summary. Trips, miles and pay across the top, attendance under them, then one row per driver and miles per driver by period against target. It filters by date, driver, operational group and pay code. Four more pages cover trip detail, trip legs, accessorial pay and a glossary.
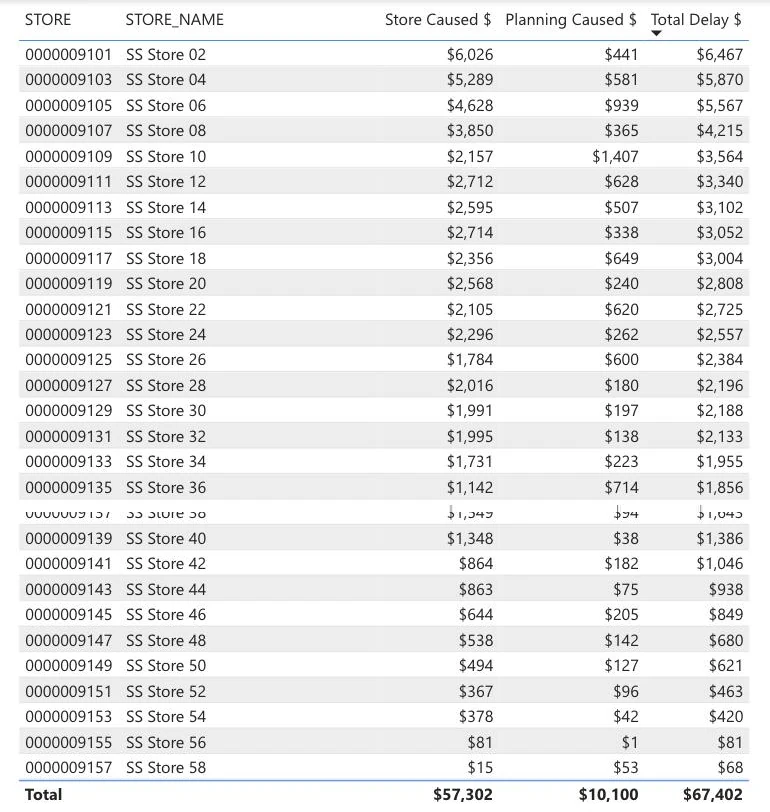
The Store Delay Cost table: delay dollars per store, split into store caused and planning caused, with totals
Delay billing, the cost view. Delay dollars per store over any date range, split into store caused and planning caused. The split is the point: it says who owns the delay, not just what it cost.

Decisions I'd defend

01

Build on the model people already use

The dwell and delay reports connect live to the enterprise semantic model rather than a private extract, so their numbers come from the same source as everything else built on it.

02

Attribute the cost, don't just total it

A total starts an argument. Splitting delay dollars into store caused and planning caused, under rules the business owner set, gives each side its own number.

03

Put the worst case first

Bottom five above top five, sorted blocks, and shading that pulls the eye to the worst stores. A district manager should know where to look before reading a number.

04

Keep the definitions in the report

The Driver Manager Dashboard has its own glossary page, so what a term means is settled inside the report instead of in a side conversation.

Where they stand

All three are published in the Power BI Service. The delay report also feeds an automated daily email to the business owner, and the Driver Manager Dashboard has been through rounds of stakeholder feedback.

Stack: Power BI · DAX · enterprise semantic model